Main menu
Skip to content
Welcome
Figures
All figures
Categorical Data
Distributions
Time Series
Scatter Plots
Maps
Illustrative Examples
Data
Reviews
Errata
Category Archives:
Time Series
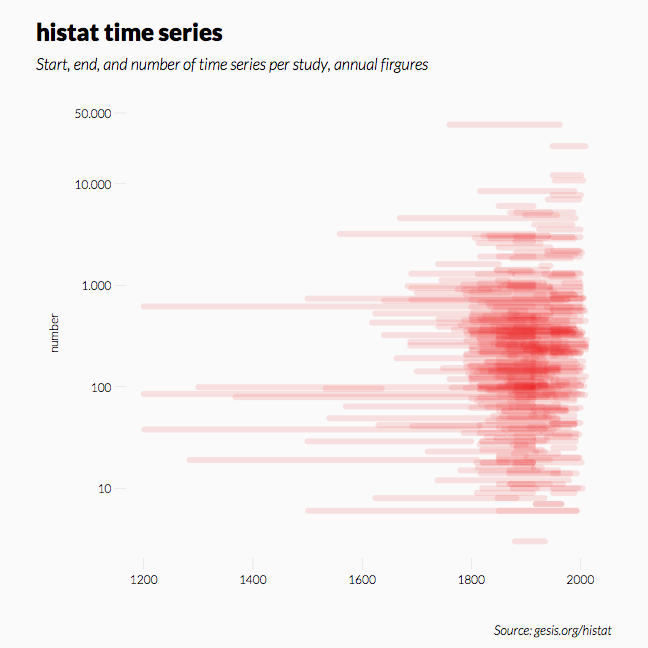
Temporal Ranges
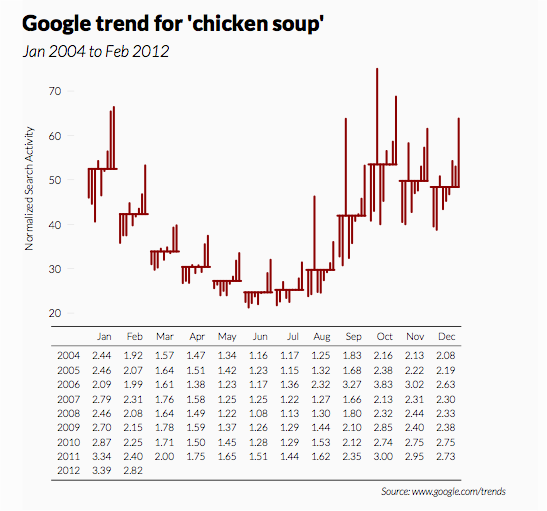
Season Figure (Seasonal Subseries Plot) with Data Table
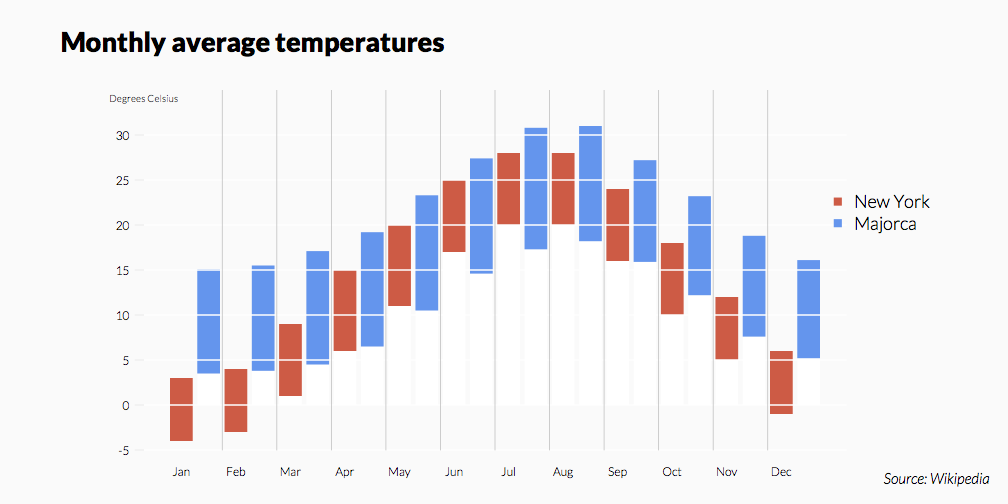
Seasonal Ranges Stacked
Seasonal Ranges (Panel)
Time Series with Missing Values
Time Series as Scatter Plot (Panel)
Monthly Values with Monthly Labels (Layout)
Monthly Values with Monthly Labels
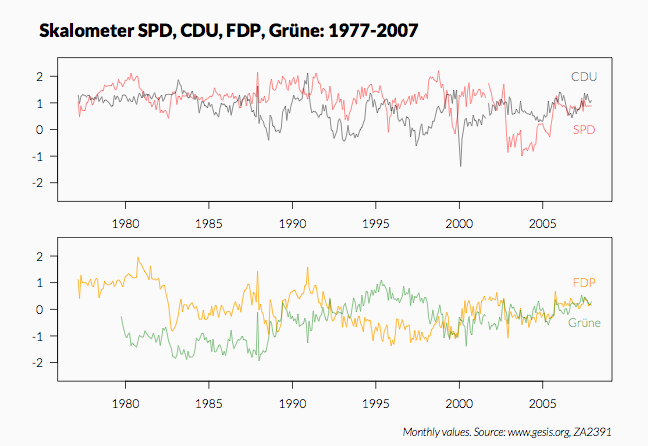
Monthly Values (Panel)
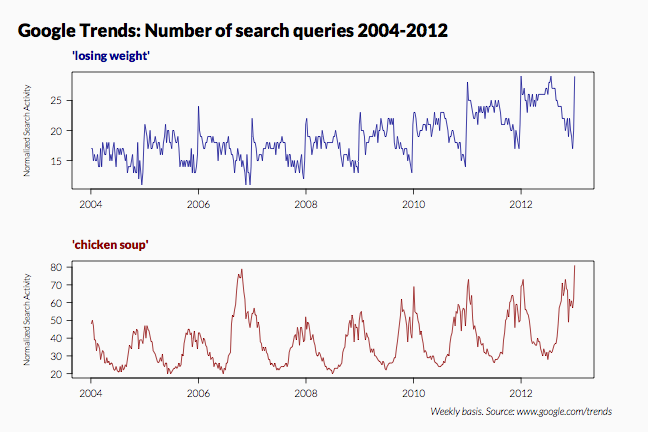
Time Series from Weekly Values (Panel)
Daily Values with Monthly Labels
Daily Values with Labels and Week Symbols (Panel)
Daily Values with Labels
Time Series with Trend (Panel)
Areas Under a Time Series
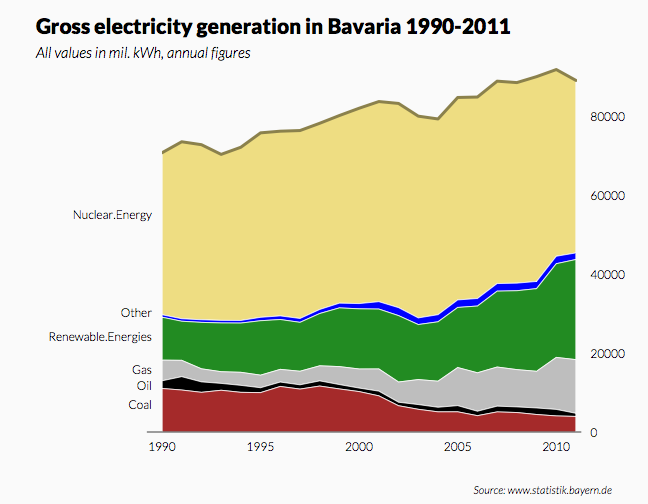
Time Series with Stacked Areas
Forecast Intervals Index (Panel)
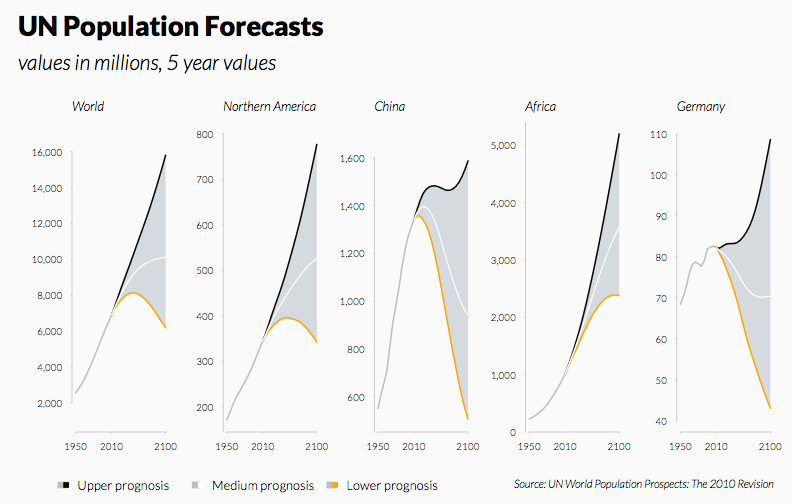
Forecast Intervals (Panel)
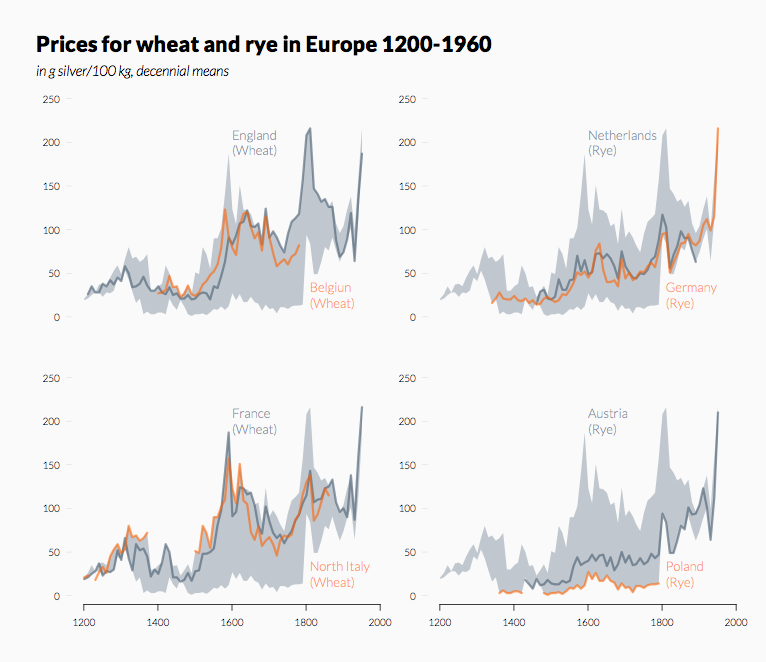
Areas as Corridor with Time Series (Panel)
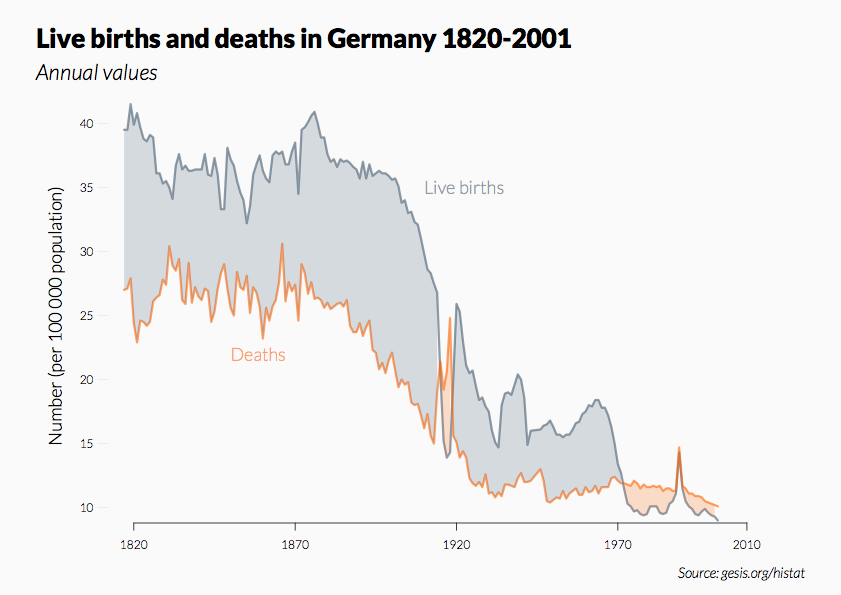
Areas Between Two Time Series
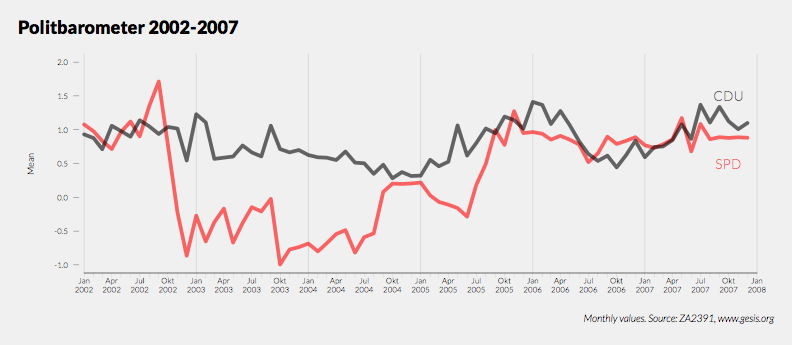
Short Time Series Overlayed
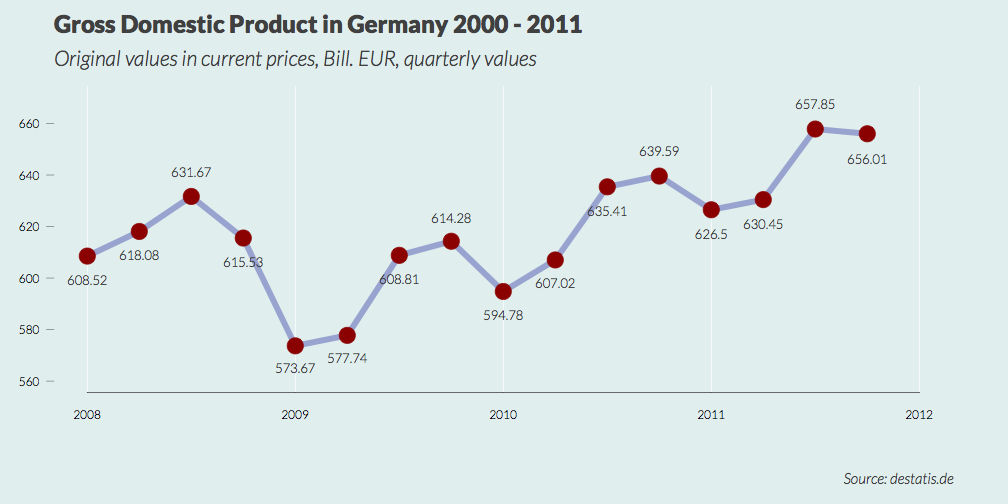
Quarterly Values as Lines with Value Labels
Quarterly Values as Columns
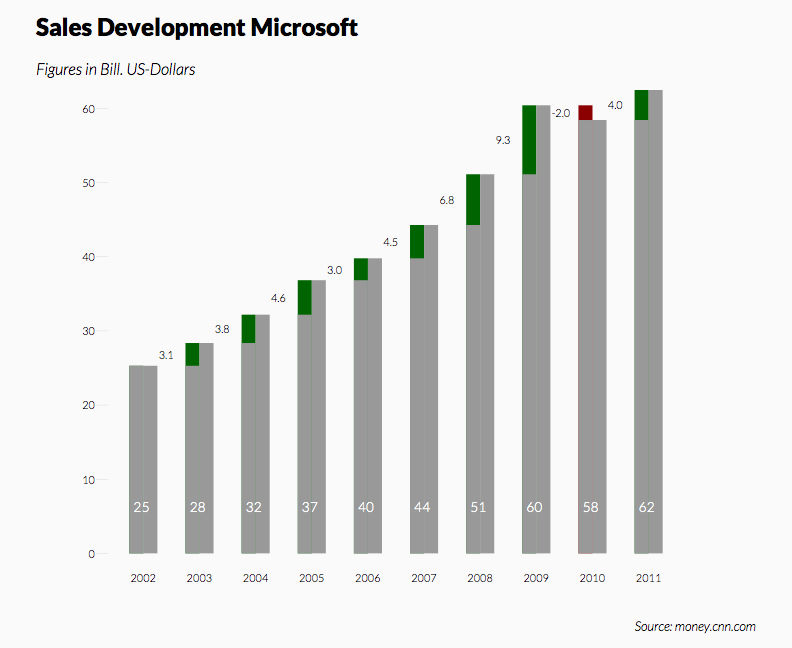
Column Chart with Percentages for Growth Developments
Column Chart for Developments