Main menu
Skip to content
Welcome
Figures
All figures
Categorical Data
Distributions
Time Series
Scatter Plots
Maps
Illustrative Examples
Data
Reviews
Errata
Category Archives:
Scatter Plots
Map of Germany as Scatter Plot
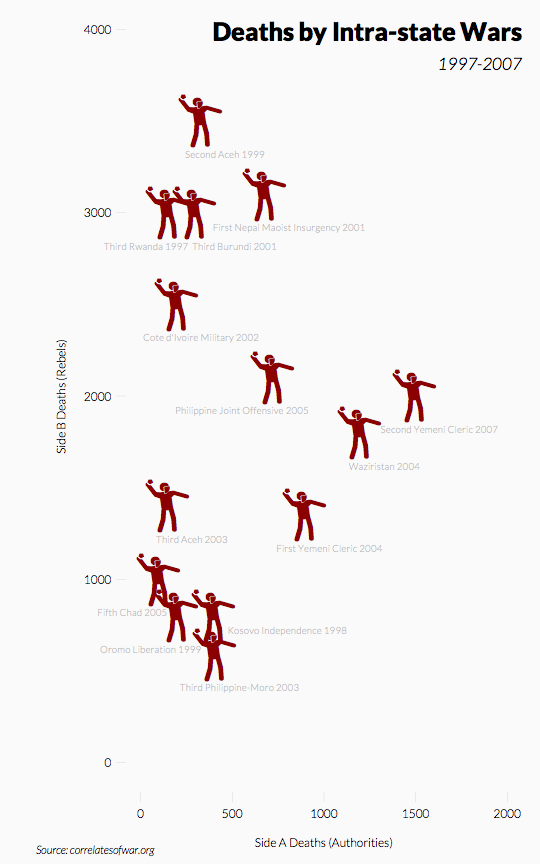
Scatter Plot With User-Defined Symbols
Scatter Plot with Few Points
Scatter Plot Variant 5: Connected Points
Scatter Plot Variant 4: Superimposed Ellipse
Scatter Plot Variant 3: Areas Highlighted
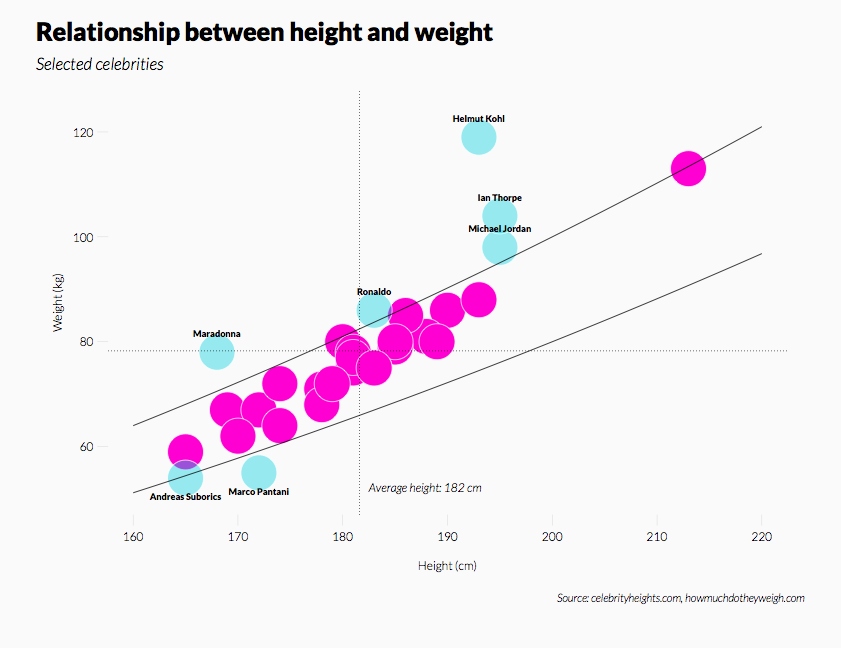
Scatter Plot Variant 2: Outliers Highlighted
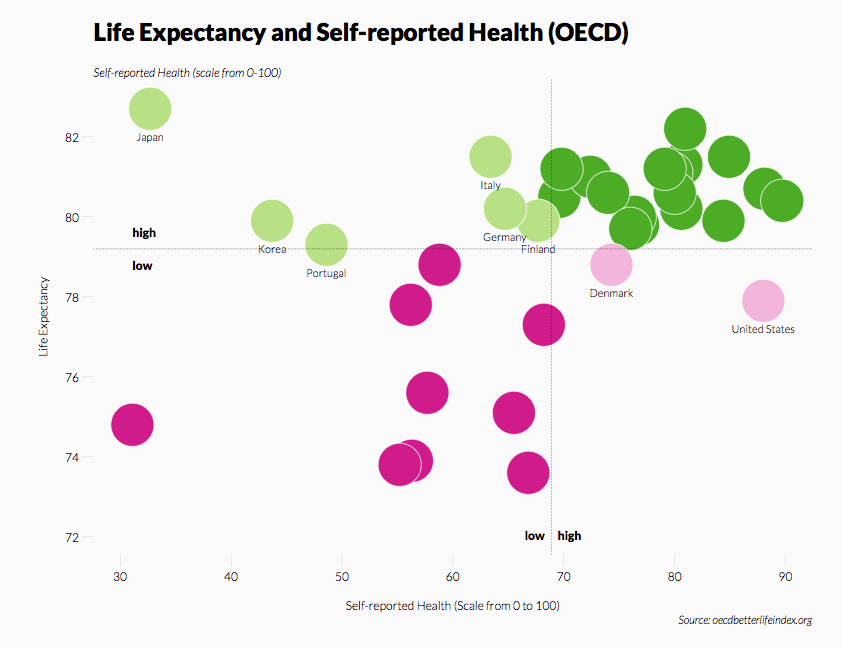
Scatter Plot Variant 1: Four Quadrants Differentiated by Colour