Main menu
Skip to content
Welcome
Figures
All figures
Categorical Data
Distributions
Time Series
Scatter Plots
Maps
Illustrative Examples
Data
Reviews
Errata
Category Archives:
Distributions
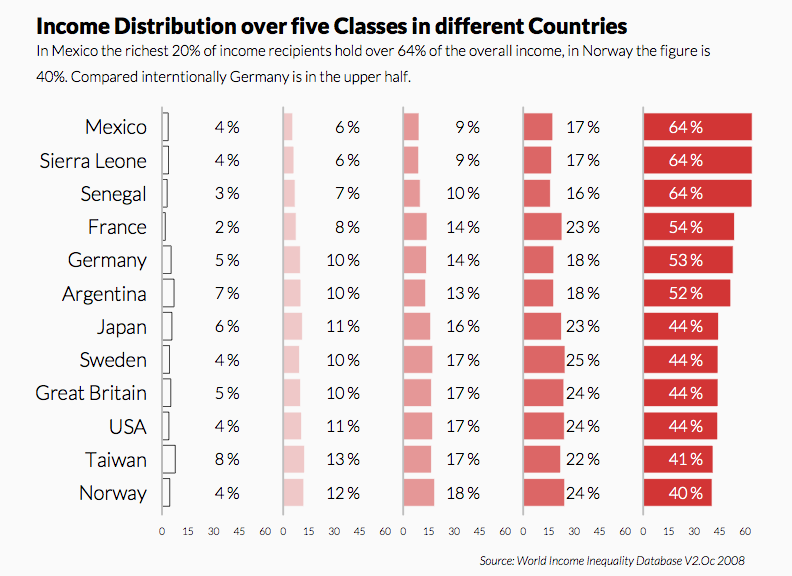
Comparison of Income Proportion with Panel-Bar Chart (Quintile)
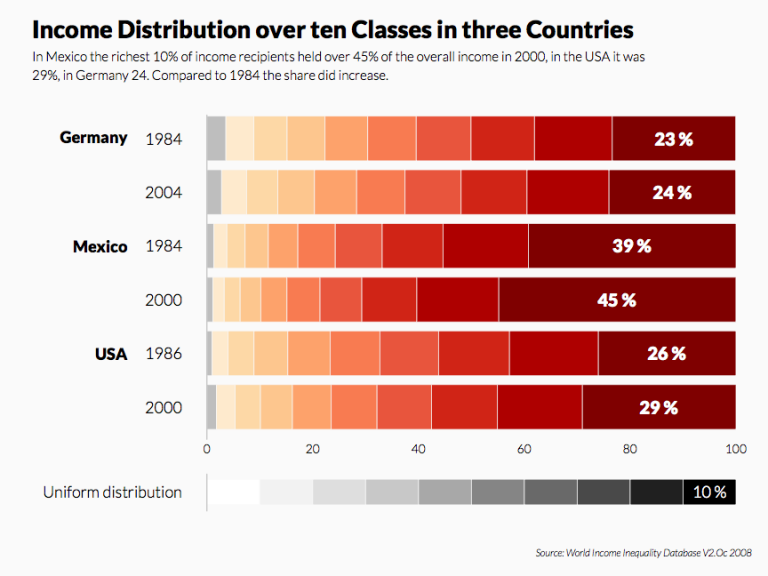
Comparison of Income Proportions with Bar Chart (Decile)
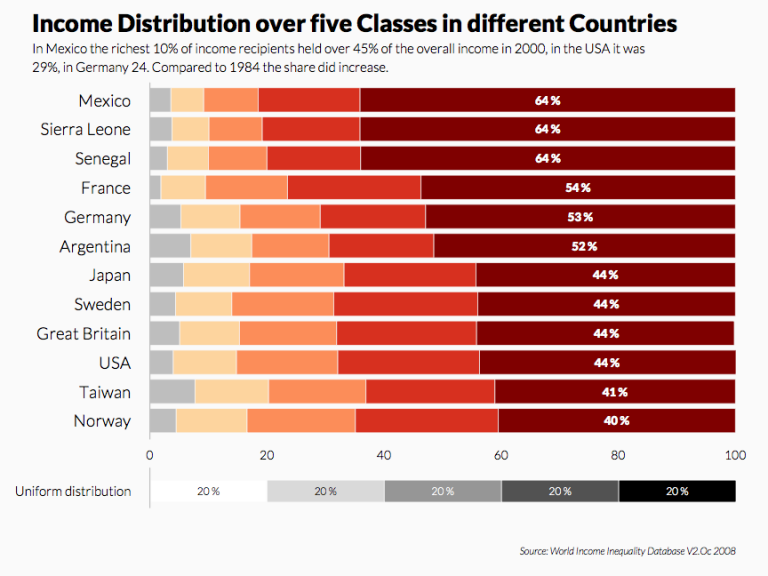
Comparison of Income Proportions with Bar Chart (Quintile)
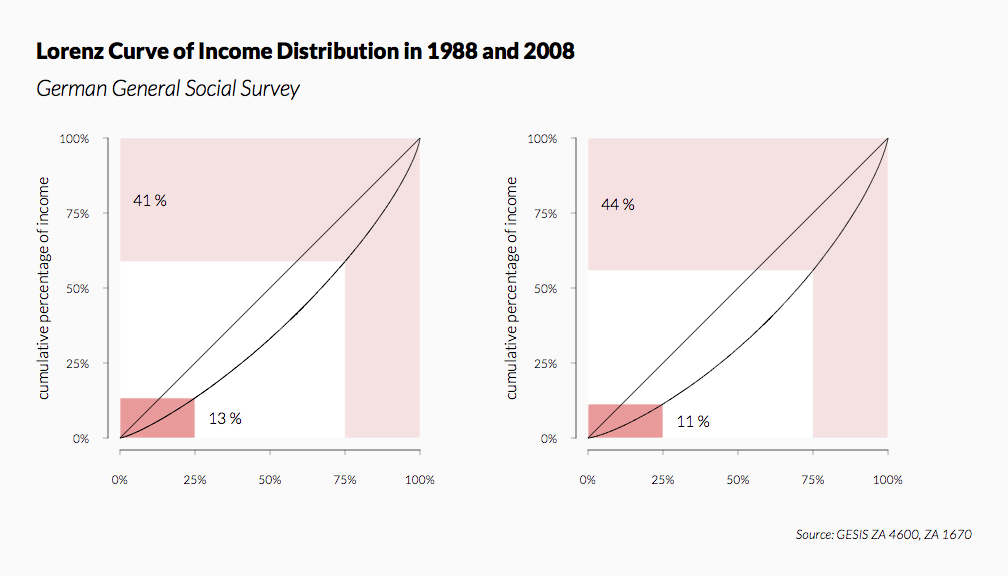
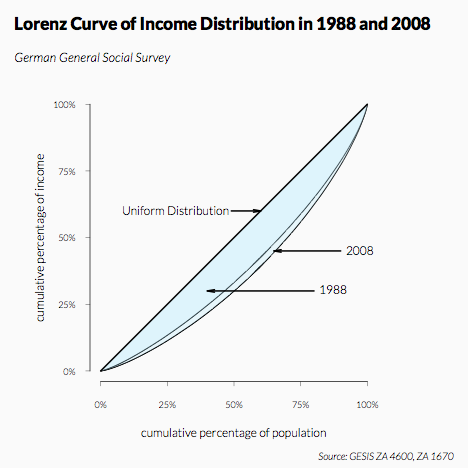
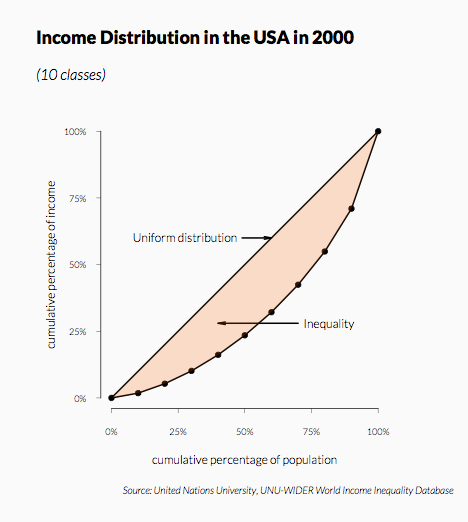
Lorenz Curves (Panel)
Lorenz Curves Overlay
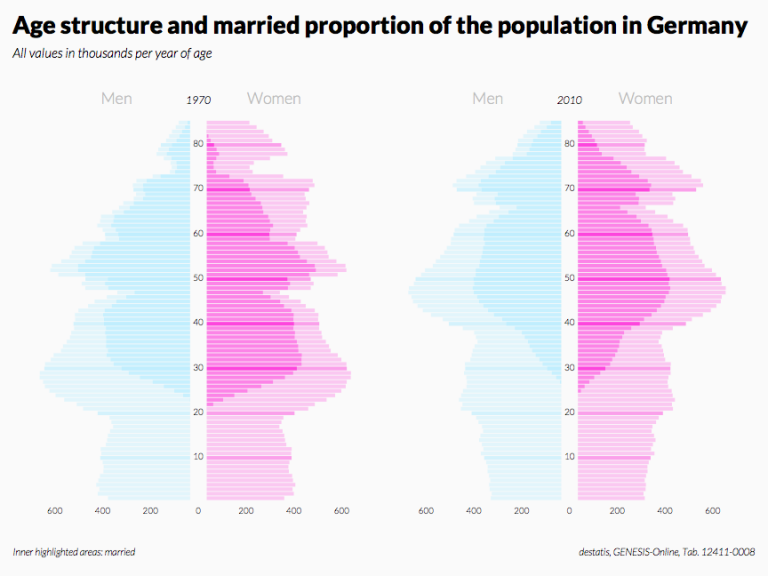
Bar Charts as Pyramids (Panel)
Aggregated Pyramids
Pyramids with Added Line (Panel)
Pyramids – Emphasis on the Inner Areas (Panel)
Pyramids – Emphasis on the Outer Areas (Panel)
Pyramid with Multiple Colours
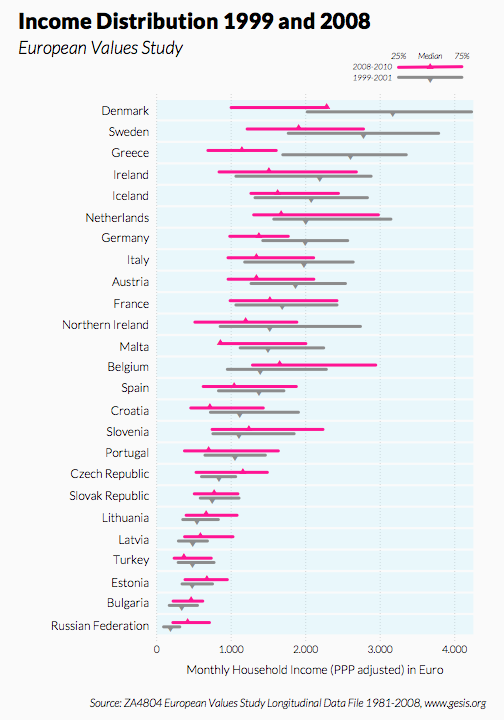
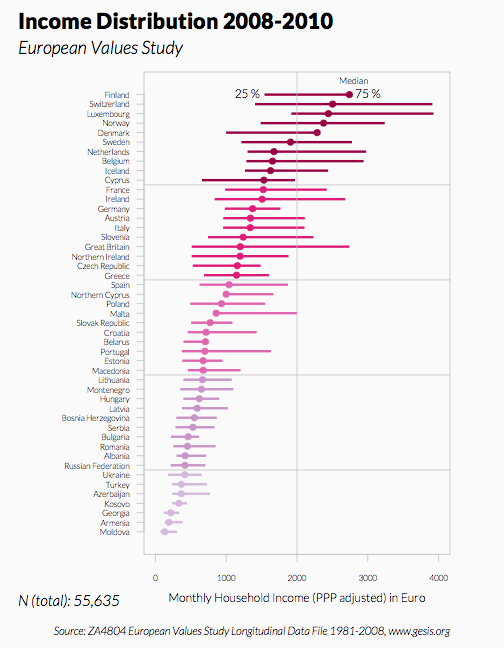
Box Plots for Groups – Sorted in Descending Order, Comparison of Two Polls
Box Plots for Groups – Sorted in Descending Order
Histograms (Panel)
Column Charts Coloured with ColorBrewer (Panel)
Histograms Overlay
Simple Lorenz Curve