Main menu
Skip to content
Welcome
Figures
All figures
Categorical Data
Distributions
Time Series
Scatter Plots
Maps
Illustrative Examples
Data
Reviews
Errata
Category Archives:
Illustrative Examples
Map of Napoleon’s Russian Campain in 1812/13, by Charles Joseph Minard, 1869
Scatter Plot Gapminder
Nighttime Map of Germany as Scatter Plot
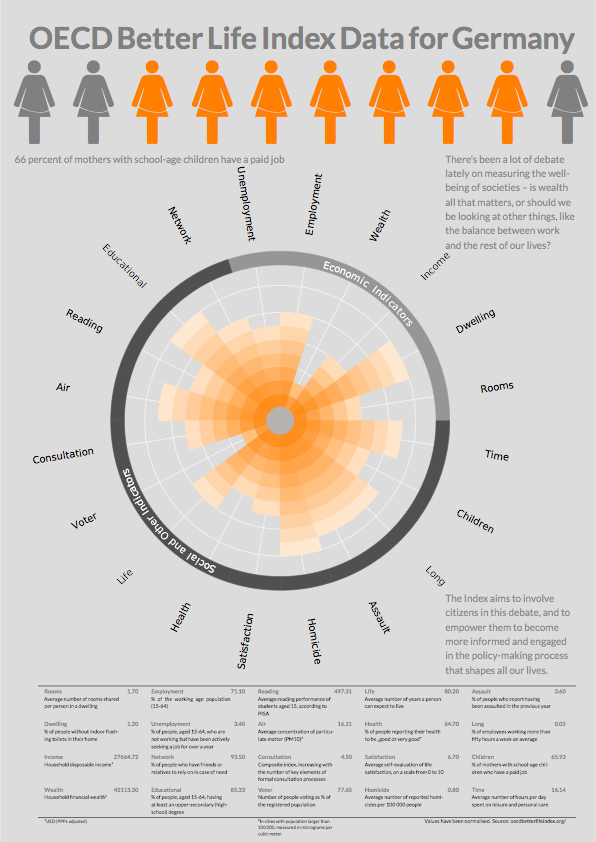
Polar Area Chart (Poster)
Polar Area Charts Without Labels (Panel)
Polar Area Charts with Labels (Panel)
Table with Symbols of the “Symbol Signs” Type Face