Main menu
Skip to content
Welcome
Figures
All figures
Categorical Data
Distributions
Time Series
Scatter Plots
Maps
Illustrative Examples
Data
Reviews
Errata
Category Archives:
Maps
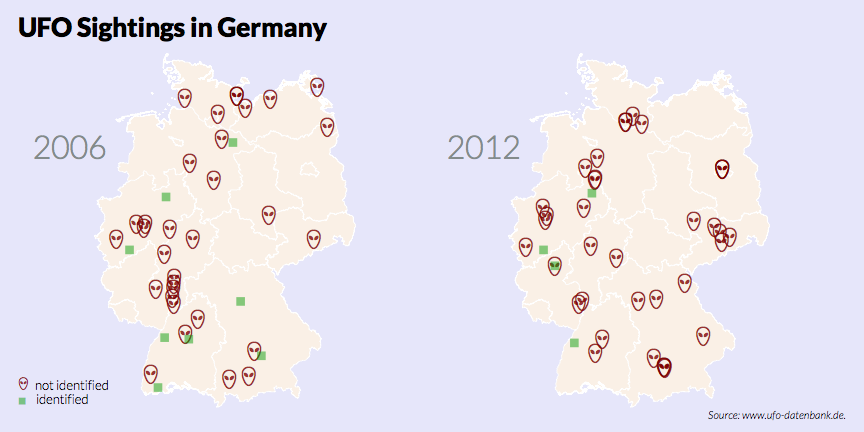
City Maps with OpenStreetMap Data (Panel)
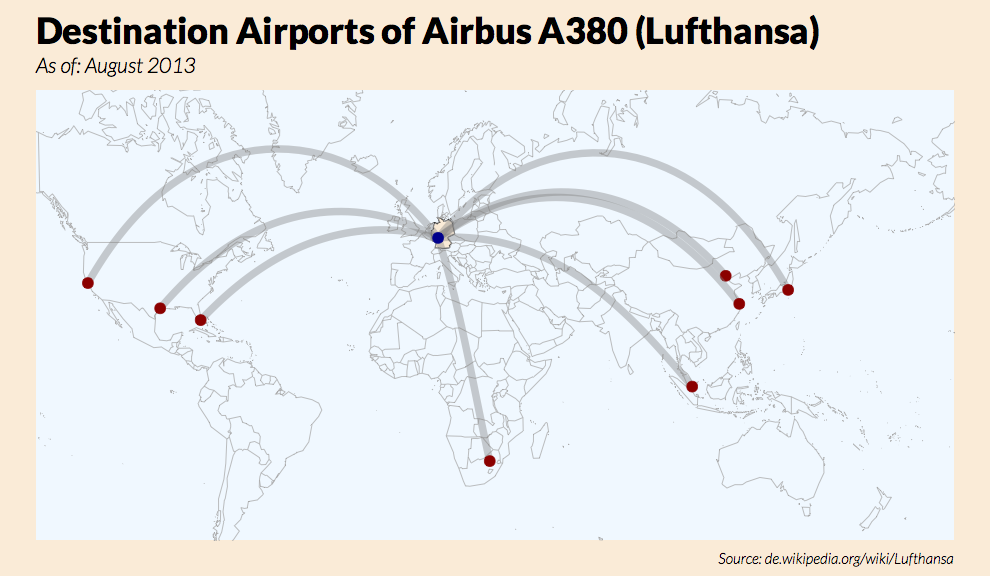
World Map with Orthodromes
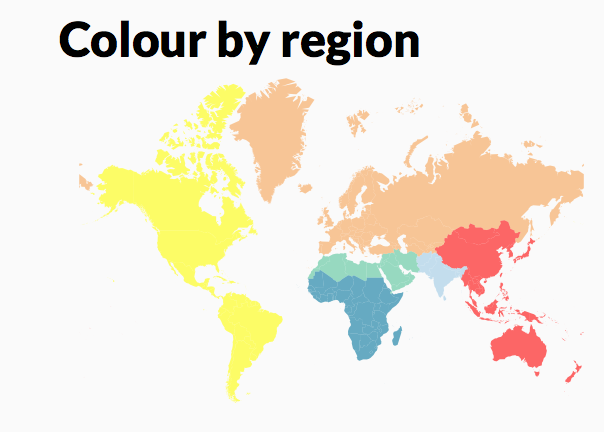
World Choropleth Map: Regions
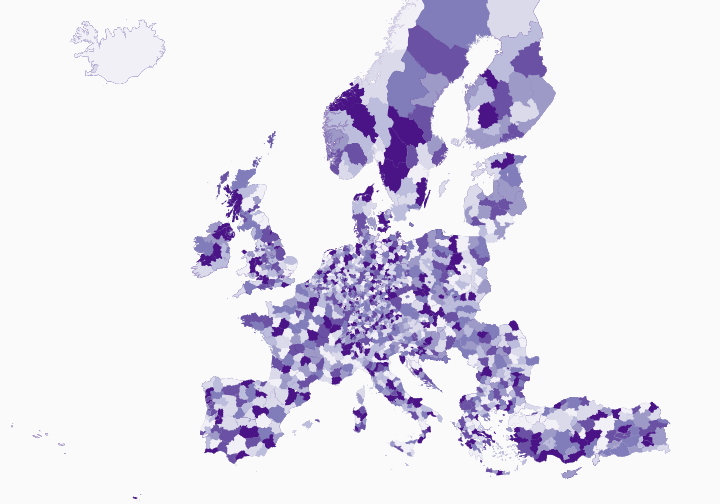
Choropleth Map of Europe at Country-Level (Panel)
Choropleth Map of Europe at Country-Level
Choropleth Map of Germany at District-Level (Panel)
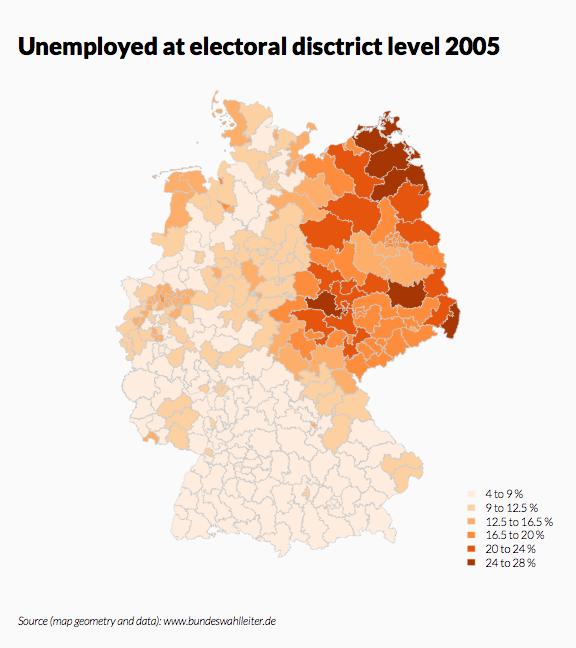
Choropleth Map of Germany at District-Level
Map of Tunisia with Self-defined Symbols
Map of North Rhine-Westphalia with Selected Locations (Symbols) and Outline
Map of Germany as Three-Dimensional Scatter Plot
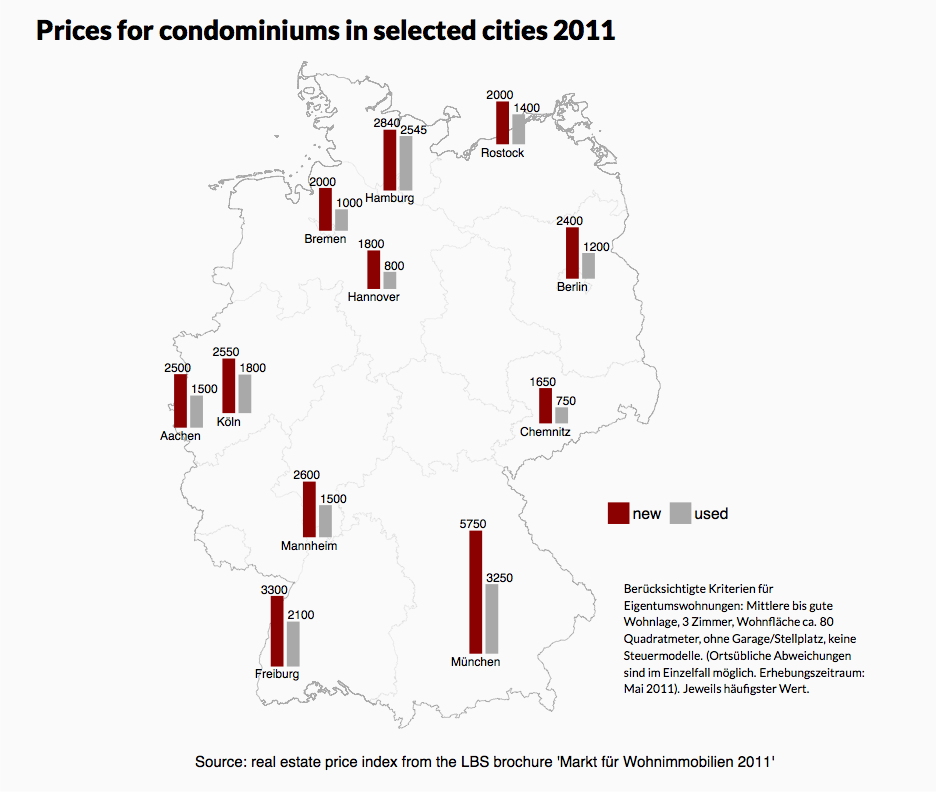
Map of Germany with Selected Locations (Columns) and Outline
Map of Germany with Selected Locations (Pie Charts) and Outline
Map of Germany with Selected Locations and Outline (Panel)
Map of Europe NUTS 2006 (Cut-out)
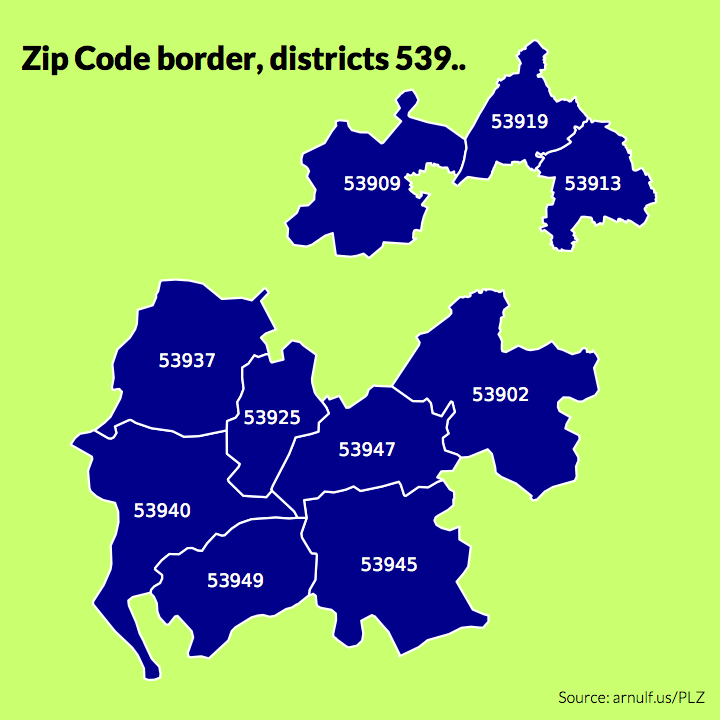
Filtered Postcode Map
Maps of Germany: Local Telephone Areas and Postcode Districts